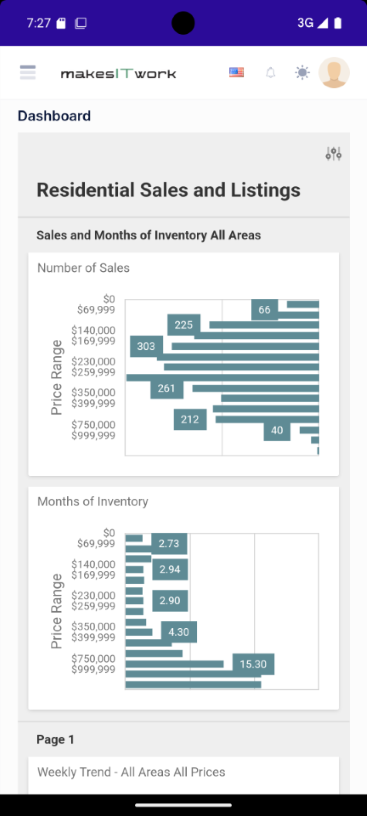
Mobile Dashboard and Menu

The Mobile Dashboard is a collection of tiles for opening graphs, reports, or application functions. The Mobile Dashboard tiles cannot be modified by a user.

Mobile Dashboard image

  • Reports: Opens the Reports View.
  • Trends: Graphs displaying Weekly Trends data.
  • Sales Count: Displays the Number of Sales by Price Range for the last 365 days for all MLS Areas.
  • Inventory: Displays the Months of Available Inventory by Price Range for all MLS Areas
  • Area Sales: Displays the top 15 MLS Areas by Sold count.
  • Area Listings: Displays the top 15 MLS Areas by Active Listing count.
  • Market: Data Report containing Market level summary statistics for all MLS Areas.
  • Settings: Application settings for the current user.
In this document