REDAGraph Docs
Documents
Back to website
  • Quick Start
  • Web Tutorials
    • Login
      • Forgot Password
    • Dashboard
    • User Settings
    • User Notifications
    • Menu Navigation
    • MLS Area Data
  • Mobile Tutorials
    • Setup
    • Mobile Report Actions
    • Mobile Dashboard
    • Mobile Settings
  • Reports
    • Report Categories
    • Report Types
    • Report Criteria
    • Report Actions
      • Create a Report
      • Edit a Report
      • Print a Report
      • Send a Report
      • Delete a Report
    • Report View
    • Listing Map
    Share on :
    Edit

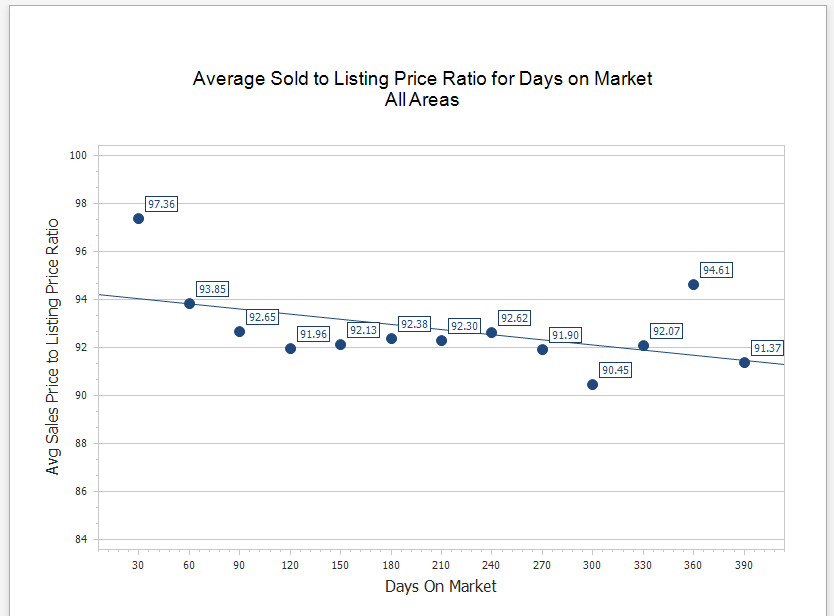
    Average Sold to Listing Price Ratio for Days on Market

    Graph of the Sold to Listing Price Ratio for All MLS Areas and Price Ranges. Provides an easy way to see how Days On Market impacts the Sales Price over time.

    avg_sold_to_listing

    Back

    In this document
    Go to top